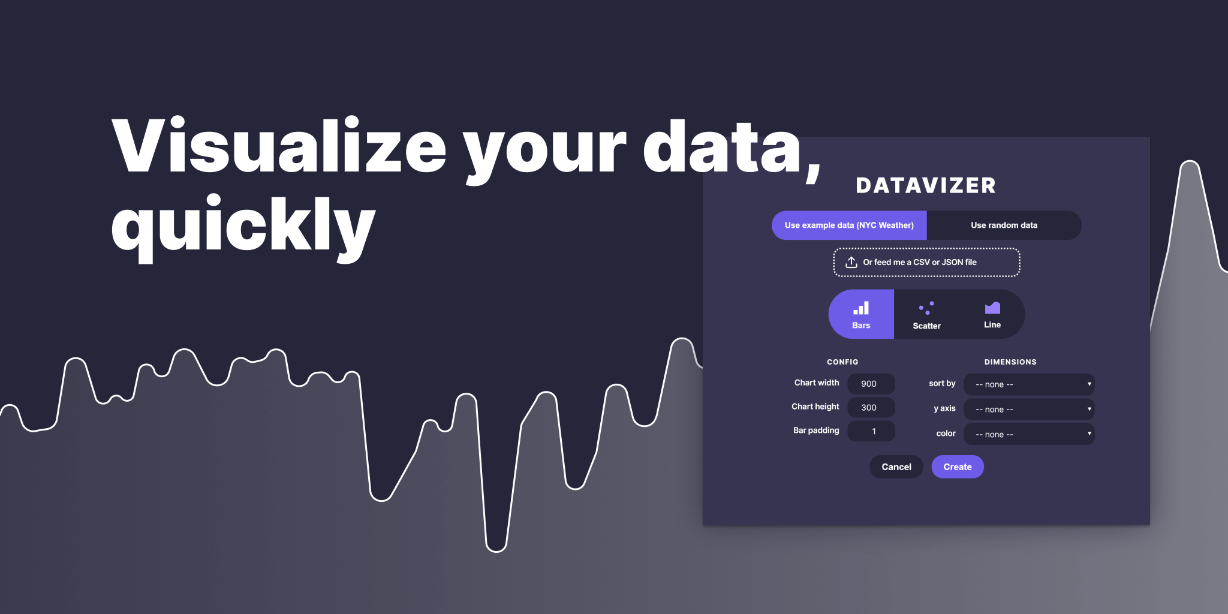
Create a bar chart, scatter plot, or line chart easily with your own data! Or use a random set of data to quickly create shapes or dummy data (for example, sparklines for a dashboard mockup). When you upload your own data (CSV or JSON file), we’ll grab any numeric keys and allow you to choose one for each relevant dimensions.
